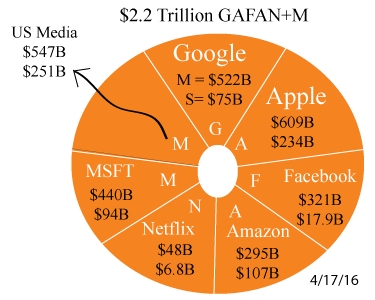
M=Market Cap and S=2015 revenues
In the early 1900’s, the business pioneers that changed the world were Henry Ford, Andrew Carnegie, JP Morgan, Cornelius Vanderbilt and John D. Rockefeller. In the early 2000’s, their equivalent is The Mighty GAFAN+M Clan, the most powerful group of business entities the world has ever known. In 2015, India was the 7th largest economy in the world with a GDP $2.18 Trillion. If GAFN+M was a country, it would bump India into 8th place.
Although Microsoft is included in GAFAN, they’re not a true GAFAN”ite” because if the Internet went caput, Microsoft could still ship out their shrink wrapped software via snail mail. In the chart below, we listed revenues and market cap for GAFAN+M and eight of the largest US Media companies. Takeaway, GAFAN+M has twice the sales of the eight US Media companies in 2015, yet 4x the market cap compared to 2x+ for the US Media companies. And why do we cover GAFAN, because they all have massive global CDN infrastructure in place.
Annual Revenue and Market Cap Comparison
| Companies | 2014 Rev | 2015 Rev | Market Cap in $B | |
| 1 | 66 | 75 | 522.4 | |
| 2 | Apple | 182.8 | 233.7 | 609.1 |
| 3 | 12.5 | 17.9 | 321.6 | |
| 4 | Amazon | 89 | 107 | 295.2 |
| 5 | Netflix | 5.5 | 6.8 | 47.7 |
| 6 | Microsoft | 86.9 | 93.6 | 440.2 |
| Total in $B | 442.7 | 534 | 2236.2 | |
| Media | 2014 Rev | 2015 Rev | Market Cap in $B | |
| 1 | Comcast | 69 | 74.5 | 150 |
| 2 | Walt Disney | 49 | 53.5 | 160.9 |
| 3 | 21st Century Fox | 32 | 29 | 57.2 |
| 4 | Time Warner | 27 | 28.1 | 58.9 |
| 5 | Time Warner Cable | 23 | 23.7 | 58.2 |
| 6 | CBS | 13.8 | 13.9 | 24.8 |
| 7 | Viacom | 13.8 | 13.3 | 16.5 |
| 8 | Dish | 15 | 15 | 20.7 |
| Total in $B | 243 | 251 | 547.2 |
